
Pandemic Onset Pricing
To better understand how self-storage operators managed their pricing during the onset of the Covid pandemic, Veritec Solutions analyzed self-storage website pricing of approximately 10,000 stores from January through mid-June 2020. Slightly less than 1,000 companies operated all these stores. We collected data daily from facilities in California, Florida, Georgia, Illinois, North Carolina, Ohio, Oregon, Pennsylvania, Tennessee, and Texas.
This period saw numerous states implement pricing regulations, although such restrictions differed from state to state. From January through June, almost 50% of the self-storage companies chose not to change their prices, either up or down. In fact, these companies did not make any price changes during this period. However, these companies accounted for less than 700 of the nearly 10,000 facilities in our sample.
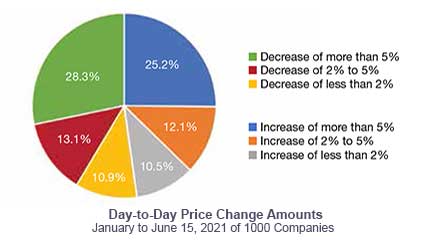
Pricing decreases were slightly more prevalent during pandemic onset.
For the other half of companies, comprising nearly 9,300 facilities, prices did change. The pie chart below highlights the sizes of the price changes made. While there were some differences by state, the pattern was similar.
Over 52% of the price changes were decreases. As you see below, we categorize price changes by those less than 2%, 2% to 5%, and greater than 5%. Interestingly, in each category of price change amount, decreases slightly outpaced that of increases. For example, about 28% of price changes were decreases of more than 5%. Compare this with about 25% of price changes were increases of more than 5%.
More strikingly, (not shown in figure), 17% of price changes were decreases of more than 10%. Yet only 10% of price changes were increases of at least 10% or greater. Companies that actively managed their prices were often willing to make relatively large day-to-day adjustments in both directions. However, the tendency to lower prices by a significant amount was more frequent than the tendency to increase prices by a significant amount.
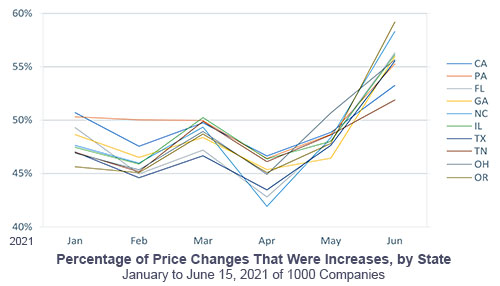
In the following graph, we compare pricing activity across states. From January through March, 45% to 50% of all price changes were increases. In April, when stay-at-home orders were becoming more widespread, price increases were less frequent. But the drop was less than what you might have been expected. Price increases still comprised about 42% to 47% of price changes. Price increase activity then increased in May and June, sufficiently so such that price increases comprised 52% to almost 60% of price change activity.
Impact of governmental pricing restrictions.
So, while many companies did not revise their prices during this period, there were also many that did. And the ones that did, tended to operate larger portfolios. Through the entire six-month period, companies that actively managed their prices were willing to increase or decrease their prices. Furthermore, changes in the frequency of price increases and decreases appear to have been more closely aligned with month rather than with state.
One take-away from this may be that no matter in which state, or states you operate, you may need to pay close attention to whom your competitors are and whether or not they have adopted an active price management strategy. If they have, you can be relatively certain that they will continue to actively manage their prices regardless of the business environment and consistent (we hope!) with state pricing regulations. If you want to compete effectively, you may need to be prepared to do the same.